Table of Contents
1Summary
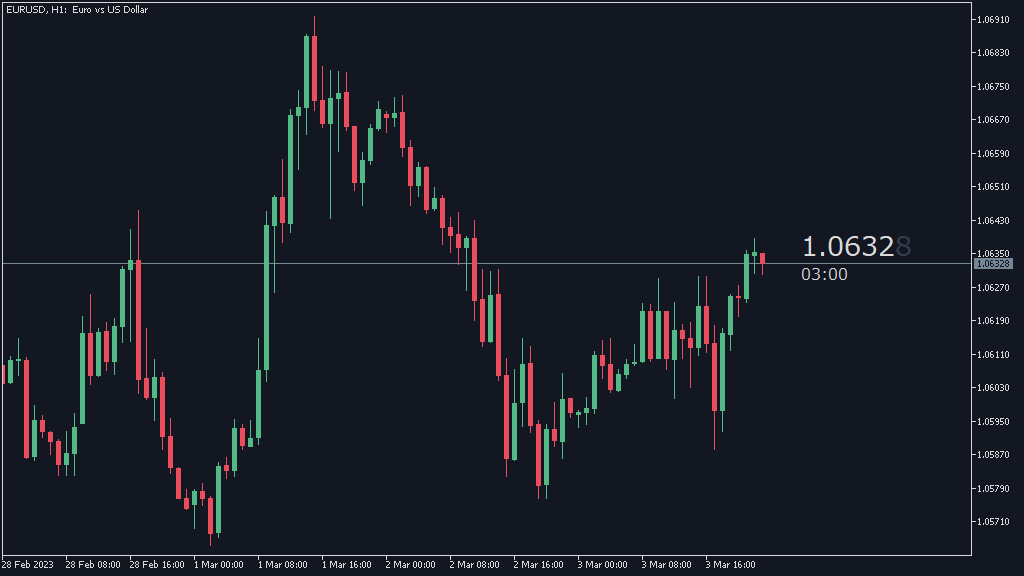
CountDown is an indicator that shows the time remaining until the candlestick is fixed and the current rate.
2Operation Explanation
Add the indicator to the chart and customize the font size, etc. in the parameter settings.
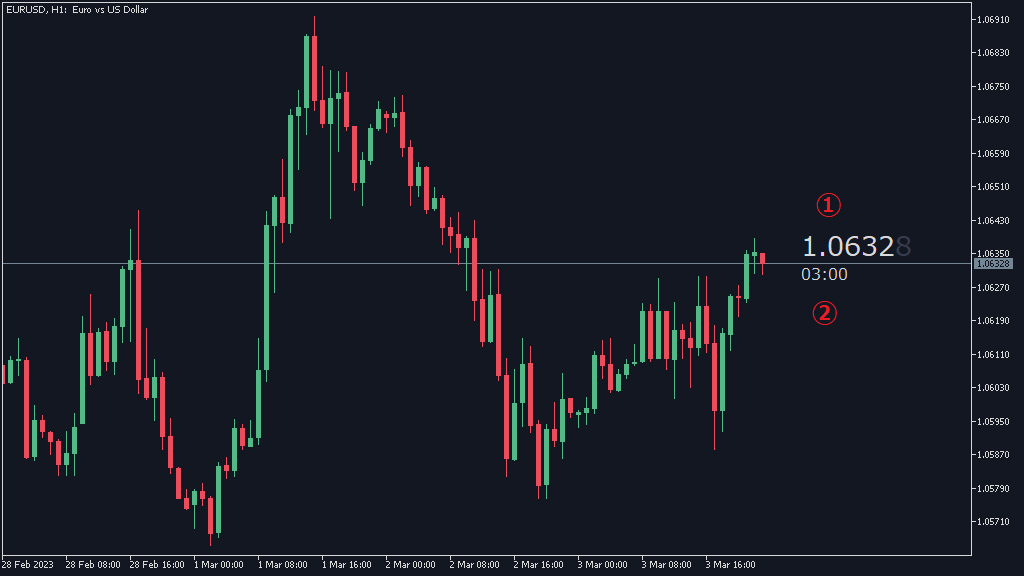
①Current Rate
The current rate is displayed.
In addition, the display color of the last digit of the decimal point can be changed for better visibility of the current rate.
②Time remaining until candlestick is fixed
The time remaining until the candlestick is fixed is displayed.
While many indicators do not update the remaining time until the tick is updated, this indicator counts down the remaining time almost in real time, allowing the user to accurately determine the remaining time.
In addition, the remaining time is displayed next to the current rate, so the remaining time can be checked simultaneously with the current rate.
3Parameter
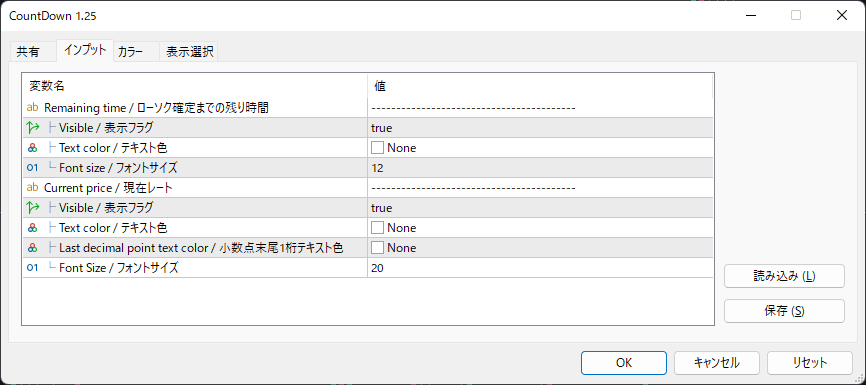
3.1Remaining time
Explanation of parameters for displaying the time remaining until the candlestick is fixed.
Visible
You can set whether or not the current rate is displayed; if true, the current rate is displayed; if false, the current rate is not displayed.
Text color
You can set the color of the text when displaying the time remaining until the candlestick is fixed; if NONE is set, the foreground color of the chart property (the same color as the rate color on the vertical axis and the date color on the horizontal axis) will be set automatically.
Font size
You can set the size of the text when displaying the time remaining until the candlestick is fixed.
3.2Current price
This is the parameter description for the display of the current rate.
Visible
You can set whether or not the current rate is displayed; if true, the current rate is displayed; if false, the current rate is not displayed.
Text color
You can set the color of the text when displaying the current rate; if NONE is set, the foreground color of the chart property (the same color as the rate color on the vertical axis and the date color on the horizontal axis) will be set automatically.
Last decimal point text color
You can set the color of the text when displaying the last digit of the decimal point of the current rate; if NONE is set, the grid color in the chart properties is automatically set.
Font size
You can set the size of the text when displaying the current rate.
4Supported Versions
| Version | Supported |
|---|---|
| MT4 | ○ |
| MT5 | ○ |
5Buy
Preparation is underway. (Subscription is scheduled to begin in April 2023)
6Version History
1.25(March 5, 2023)
The display color of the last digit of the decimal point has been added as a parameter, allowing you to set the color to your preference.
1.24(September 25, 2022)
Fixed display misalignment when changing scales with no rate distribution.
1.23(September 24, 2022)
A flag for displaying the time remaining until the candlestick is fixed has been added to the parameter, allowing the user to set the time remaining until the candlestick is fixed not to be displayed.
1.22(January 2, 2019)
Indicators can now be displayed in sub-windows by drag-and-drop.
1.21(December 14, 2018)
Fixed a bug related to the display of the current rate for currency pairs without a decimal point.
1.20(November 4, 2018)
A flag for displaying the current rate has been added as a parameter, allowing the current rate to be set to not be displayed.
1.10(September 23, 2018)
Regarding the text color specification, when NONE is selected, the foreground color of the chart property setting is now automatically set.
1.00(July 9, 2018)
First public release.